Dow Theory Overview
Dow Theory is one of the oldest theory related to Stock Markets. It is still considered as the corner stone theory in area of Stock Market technical analysis. This is the reason I selected Dow theory to start my technical analysis section of this website.
In this article we will learn about Dow Theory and see how it helps us understand market better and more importantly become better traders.
Dow theory explained
Below are six important postulates of Dow Theory. I will also explain them to help you understand it better.
Video explanation in English
Video explanation in Hindi
1. Market discounts everything
Now this is important and is corner principle of my Fundamental analysis of stocks. Price of a stock or market reflects everything going on at that particular point of time. Even news like Earth Quake and Hurricanes are also discounted by market. For example you may see Oil prices and Oil marketing companies getting impacted if Oil fields are impacted by any natural calamity.
2. Market has 3 trends
Lets understand Uptrend and downtrend first. If market makes high higher than previous high and low is higher than previous low then it is uptrend. Now if market makes low lower than previous low and high lower than previous high then it is downtrend.
Now after a uptrend prices do recede back and then move again rise to touch the high. After that it will have moderate decline. This can be applied to stock movement as well as index movement. These trends are named as Major, Secondary and Minor
3. Major trend have 3 phases
There are two types of investors Big investors like Institutes and Small investors like you and me. When the prices are down and everyone says market crashed and economy is doomed this big players slowly buy the stocks. This is called Accumulation phase.
The prices start rising and then small investors like we start buying the shares. So prices keep moving up. This is the participation phase. Retail investors at most times buy at higher price. Then comes a period that everyone says market at its peak and economy and everything is just awesome.
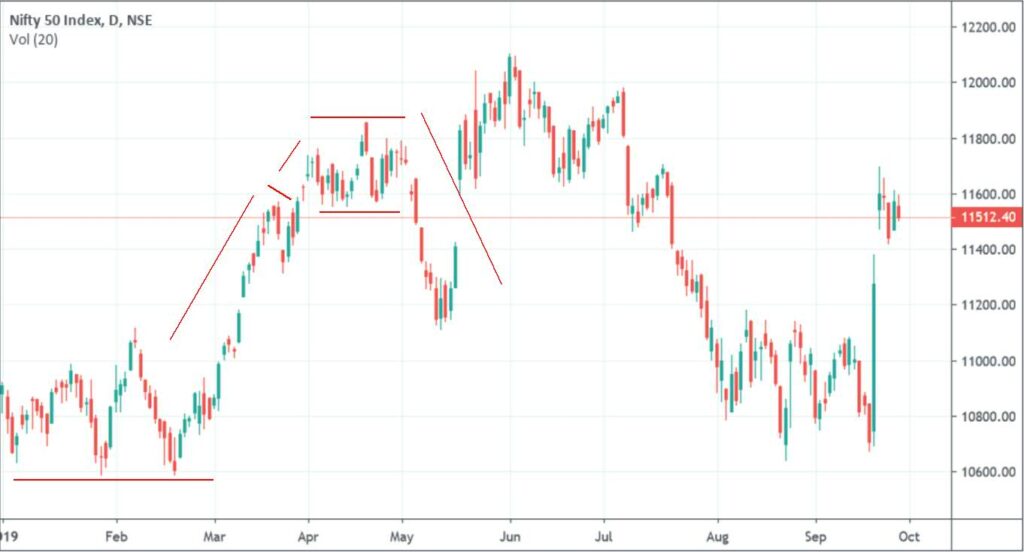
At this phase big players start selling and market losses the pace and comes down. To understand this concept you can see last 5 years of Nifty. Market will go up without any reason and fall without any rationale.
4. Volume should be with you
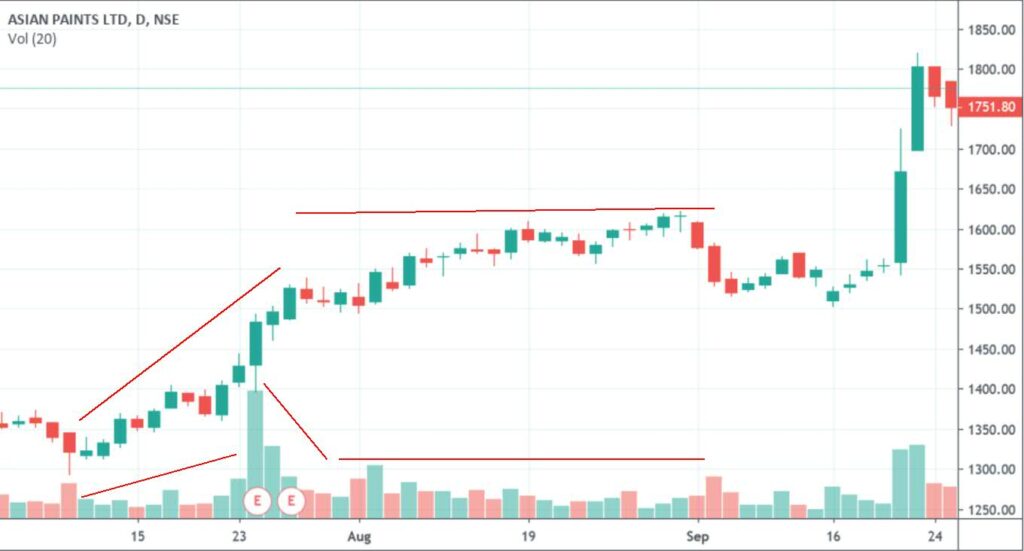
This is important for stocks. If a stock is rising or falling always have an eye on volume with which it is rising or falling. If the volume is higher than most days average then it confirms the direction of trend.
For example if volume is increasing with price and decreasing with price decline means Uptrend is intact. If volume is increasing with price decline and decreasing with price rise then downtrend is intact.
If the uptrend or downtrend is not supported by volume means the trend is becoming weak and it may reverse after sometime. This is very important concept for technical analysis.
5. Follow the Trend as reversal needs excuses
You may have heard technical analysts on Television saying follow the trend or trade in direction of the trend. The reason is trend does continue if there is no abrupt reason to reverse.
Any political or news related to stock or economy can abrupt the trend and with time reverse it as well. If the market is near peak or high point then impact of this news driven reversal is more. So you should look for the reversal signal during a uptrend or downtrend.
As we progress with our Technical analysis chapters you will see how to identify the trend weakness.
Conclusion
Note above postulates are very important. People try to find the indicators which will help them trade and make money. But before diving into indicators we need to understand the basics of the market movement. Indicators are derived from Price and Volume.
But the concepts are based on general perception of the market and does help in your understanding and application of indicators.