What is Support and Resistance?
This article is part of series of articles on Technical Analysis basics. In this article I will be explaining support and resistance. If you follow business news then you may have noticed usage of these terms frequently.
These two terms are so often used but are understood very little. In this article I will try to explain these terms in simple language. But you should also read the chapter on 3 types of trends to understand trends as well.
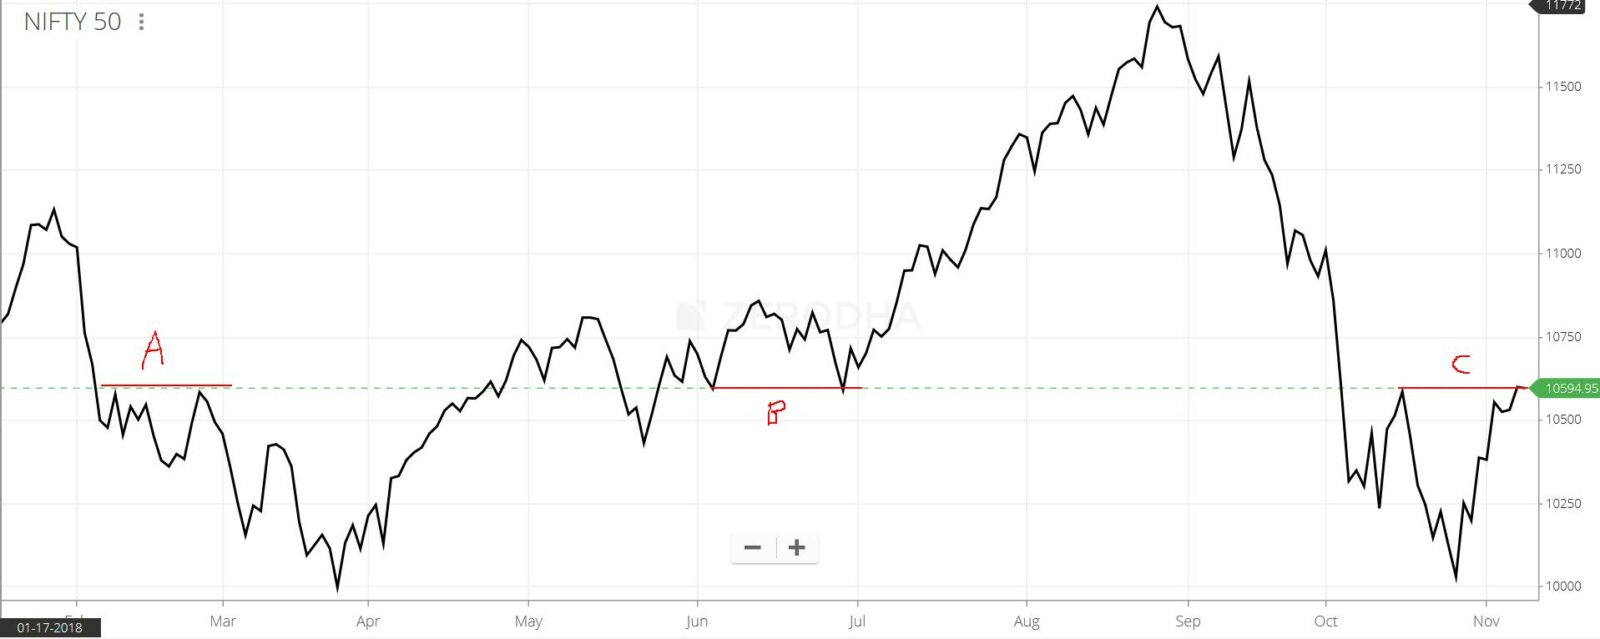
Below image shows Nifty 50 over year 2018. The image has lines denoted by A,B and C. I will explain the points A , B and C later in the article. First you can have a look at the image.
Understanding Resistance
English Video
Hindi Video
Resistance is the point (price point) from which Stock or Index move downwards. If you look and A and C then you can clearly see pries touched 10,600 and then moved downwards.
At point A (start of line on left) it touched 10,600 and then moved downwards. It again touched that point after few days and again moved downwards. So the price 10,600 acted as a resistance. Nifty 50 was not able to move beyond that price.
The same price point 10,600 acted as a resistance at line C. If you see prices after sudden fall rose and again fall after touching 10,600.
Understanding Support
Support is the point (price point) from which stock or index move upwards. Now look at point B. The price reached 10,600 at start of price B. It moved upwards but again fall back. At end of line B it touched 10,600 again.
Now after touching that price again Nifty 50 did not go below it. It moved upwards. So at point B the price 10,600 acted as a support. It was the price below which Nifty 50 falling prices took support and moved upwards.
Support and Resistance are Same
Now this is interesting concept and well explained by above image. If you see 10,600 is acting as Resistance at point A and C. The same price is also acting as Support at price B. This is true for all Support and Resistance prices.
If stock prices are falling then Resistance becomes Support. For example at B. After moving past 10,600 at start of line prices started falling. It then touched 10,600. 10,600 was resistance at line A. But now it is acting as a Support since prices are falling.
Similarly Support acts as a Resistance if prices are rising. For example at point C. Prices fall below 10,600. The prices started rising and at start of line C it touched 10,600. Since prices are rising the 10,600 acted as a Resistance in this case. Note earlier at point B when prices were falling it acted as Support.
So support and resistance are same point. The change their role based on direction of price. If price is rising then that point act as a Resistance and if prices are falling that point act as a Support.
Some key Points about them
- All Support and Resistance are not that strong. Some are very strong and some are weak.
- The longer trade happens near a price point. The stronger Support or Resistance that price becomes.
- Volume is very important for Support and Resistance. The higher the volume at Support or Resistance the stronger that point is.
- A Support or Resistance formed recently is more important than one formed long time back. Prices first break or respect recent Support or Resistance and then previous one.
Support and Resistance trading strategy
If you read my articles on trends then you know that traders should trade in direction of trend. Also it is important to notice the trend reversal and trade for trend reversal. These are two types of trades analysts and books tell you to trade.
You can make both these types of trades using Support and Resistance. Note if above image we have used Closing price. For one support or resistance to break Closing price should be greater than that Support or Resistance.
1. Trend will continue
Lets understand the trading strategy. If prices are near Support then you should trade with view that prices will bounce from that point. That is prices will touch Support and then move upwards. Similarly for resistance prices will touch that point and move downwards.
Assuming this you can plan your trade. It can be trade in cash or futures or options. All the trade options will work. With this trade strategy you assume that trend will continue and Support will help it continue the trend.
If you see this trading strategy works well at line A , B and C. So you can make profit at these points using above trade strategy.
2. Trend will reverse
This is the second strategy. Trend do get reverse and then enter new trend. For this to happen prices should break Support and Resistance levels. Support and Resistance are broken and then Support becomes Resistance and Resistance becomes Support.
When prices are near Support or Resistance you should check if the closing prices are above Support and Resistance for couple of sessions. If that is the case then trend reversal may be in progress. In that case you should not make any trade in direction of trend.
3. Using Strength of Support and Resistance
The stronger the Support and Resistance are the lesser the chances of it getting broke easily. This concept is very important. If prices have broken major support or resistance then it means prices will decrease or increase a great deal and make new lows or highs.
(Note if it broke support then prices will move downwards making lows and if broke resistance then prices will move upwards making new highs).
So if prices are trading near major support and resistance most of the times prices fall back that is trend continues. It does break the major support and resistance only if
- It has tried to break it in past (recently) and failed
- The volume is high on the day and closing price is above Support or Resistance
- There is major news which makes things super bullish (to break resistance) or super bearish (to break support)
Conclusion
Support and Resistance are key point in trading. Many books suggest to trade near Support and Resistance points. The reason is simple. In that case it is easy to predict the movement of Index or Stock. People assume that the trend will continue.
If the volume is less near Support and Resistance or there is no major news then chances of it getting broke is very slim making the trade more profitable.
In the next article we will discuss about one more interesting concept of technical analysis.