In previous chapters we discussed about Trend Lines and important principle of trend lines. In this chapter I will cover some advanced topics for people who would like to know more about it.So without wasting time lets get started.
1. Trend Line Slope
Trend Line slopes are important. It will help you draw them correctly. You should ignore flat trend lines and too steep trend lines. The flat ones show balance between bear and bull and steep ones show panic buying and selling.
The flat ones that is consolidation phase is moment on no trend and market just want to spend time between some price ranges. The steep ones are ones where everyone wants to buy or sell without much thinking. This frenzy buying or selling does not sustain with time and eventually dies out.
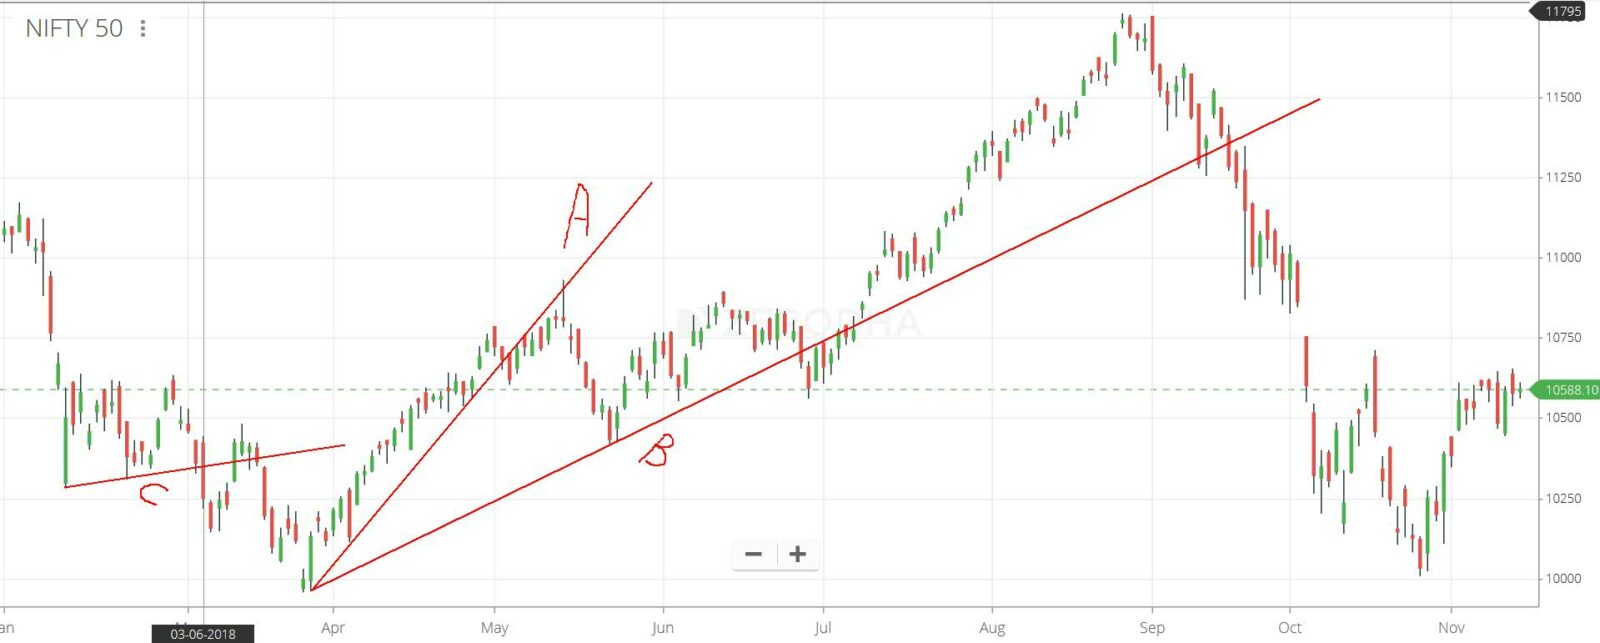
In above image A is too draw incorrectly as it takes two very close points to draw the line. The steep slopes do not sustain for long and eventually dies off. The Line B has good slope and is best fit for drawing. It clearly shows the trend and also predicts the down ward reversal at later point of the year.
The line C is again too flat and is not good fit for drawing. It should be ignored.
2. Channel Lines
Channel lines are one of the application and trading strategies in Trend Line concept. Once you have created or drawn a trend line you can look if there exists a Channel line. It is the line which denotes upper limit of the prices in trend.
So if prices are above Channel line then you can make Short position like partial profit book or put position if you are option trader. The prices touch the channel line and cool off for sometime. Then they again rise and touch the Channel point.
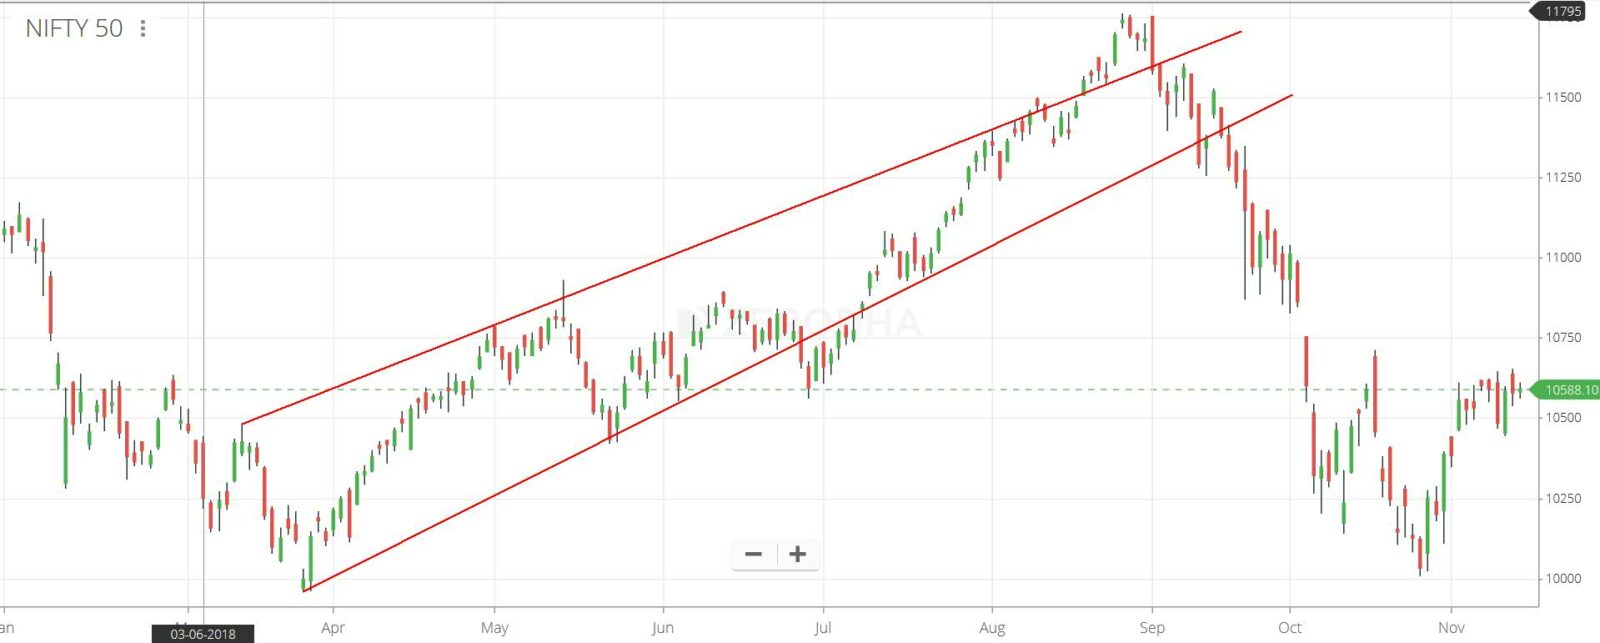
Note some books or online materials show you perfect Channel lines but those are misleading. In real world nothing perfect is present. Lines will be somewhat distorted. When the prices cross the top line then it is time to book profit or make Put positions for trading.
3. Retracement of Prices
In above images you may have noticed that prices tend to move down and then move up. This up and down movement is present in downtrend or uptrend. People want to make profit if prices have increased to some extend. This general tendency of partial profit booking is reason you see prices coming down and then going up.
After upmove prices come down this phenomenon is called retracement. Normally people consider 33%, 50% and 66% percent as Minimum, Normal and Maximum retracement percentages. If the retracement is 66% or more than there is high chances of reversal on cards.
Generally 33% is the normal in good up trends or downtrends. For example if prices rise from 100 to 200 then chances are that it will come down to 150 and then bounce again if the original trend is intact.
4. Fan Principle
Some books will have reference to it. But personally I do not use it much. It is difficult to find in a price and people sometimes make mistake drawing it. I am just mentioning it here so that you do not get confused hearing the term somewhere.
You need to draw 3 lines from top or bottom of the prices to the top and bottom prices. As you need to connect 3 tops or bottom it may be difficult to get them in daily chart. You may have to consider long time period in such cases. For daily trader this chart does not make much sense. So it is better not to waste time on it.
Conclusion
Trend Lines are one of the most basic concepts of Technical Analysis. It was the early tool draw by traders to understand market momentum and reversal patterns. If you have understood basic concept behind these lines then you can easily understand rationale behind other ones as well.