Trend Line Basics
In previous chapters we read about 3 types of Trends and Support Resistance. If you have not read those article then please do so. Those concepts are important for understanding of this chapter.
Trend Lines are one of the basic technical tools. Nowadays people can draw it using Computer or similar software. In earlier days people used to draw it on paper. Trend Lines are drawn to understand the trend direction and predict the future price movement.
It also tells you if trend is losing momentum and an idea of trend reversal. Trend and trend reversal trading strategy using Support and Resistance in already discussed in previous chapter. The same trading strategy is also applicable in this case.
How to draw Trend Lines?
English Video
Hindi Video
Text Description
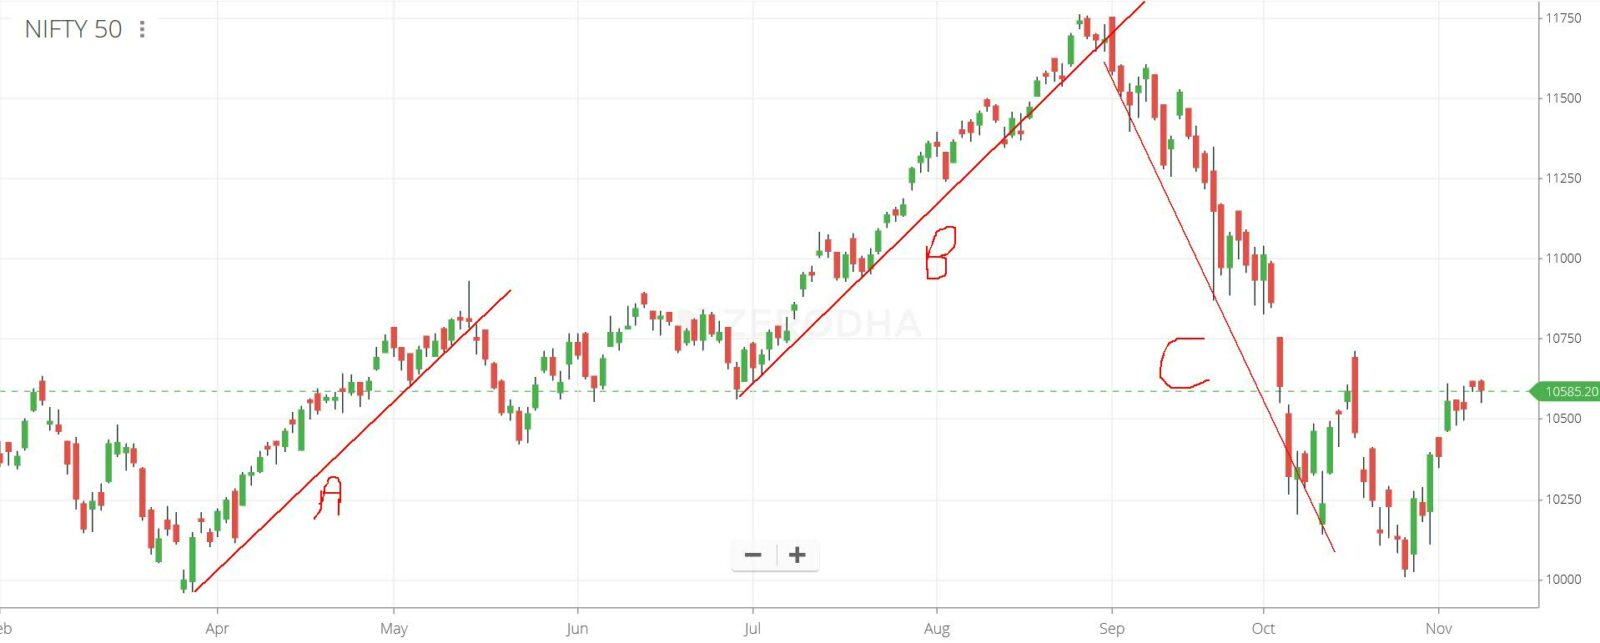
I have shown trend lines on Nifty 50 daily chart for last 9 months or so. This will give you an idea on how to draw trend lines of graph. There is no need to draw it always you can visualize the same as well.
First you have a look at the image then we can discuss about the trend lines after the image.
I prefer drawing trend lines using Day’s low. Days low takes care of all the price movement on that particular day. Now trend lines can be drawn based on closing prices. As closing prices denotes at what point days tussle ended.
Some people use average of days movement (like sum of Open Close High and Low divided by 4) to draw the trend line. This takes away any abrupt movement in prices during the day.
Which ever method you follow it gives decent result most of the time. The only time this method fails is if there is any abrupt market movement based on some news.
If you see above A and B are positive trend lines. The prices are moving upwards and point C is negative trend line. The prices are moving downwards.
You just have to draw a straight line from one days closing or opening or average. In the next section we will see how you can use this simple strategy to trade.
How to use Trend Lines for Trading?
Trend Lines give important insight into future price movement if trend continues. It also gives idea if the trend is on decline and will reverse with time.
If the prices are above trend line or inline with trend line then it is said that trend continues.If the prices move below trend line for one or two trading sessions then trend gets weaken and may get reverse soon. This get reflected in the line A and B both.
At point A the trend weaken and then goes to consolidation and again continues into Primary trend that is positive trend with line B. If you see after positive trend line B the prices close below trend line and then major down trend starts.
The down trend C then continues signifying trend reversal. This way you can plot trend lines and understand movement of prices. A major trend may have some minor trend reversals and after that original trend may continue.
This was reflected at line A. It was a positive trend and after that there was sudden decline on prices. Between trend line A and B there were minor trends (both positive and negative) and after that the original positive trend continues.
You can now revisit Dow theory. That theory explains well the minor trend between the major ones. The one discussed above is the simplest form of trend line. We will see advanced level of trend lines and its constructions in next articles.
Advanced Section
For now this basic tutorial on trend lines will give you an idea about the topic. After this basic understanding we are prepared to dive deeper into the topic and create wide range of trend lines and trading strategy based on that.
In this section we will see some important characteristics of Trend Line one should know. These help you understand them better and identify specific clue which you can use to set up your trading plan
1. Identify Valid Trend Line
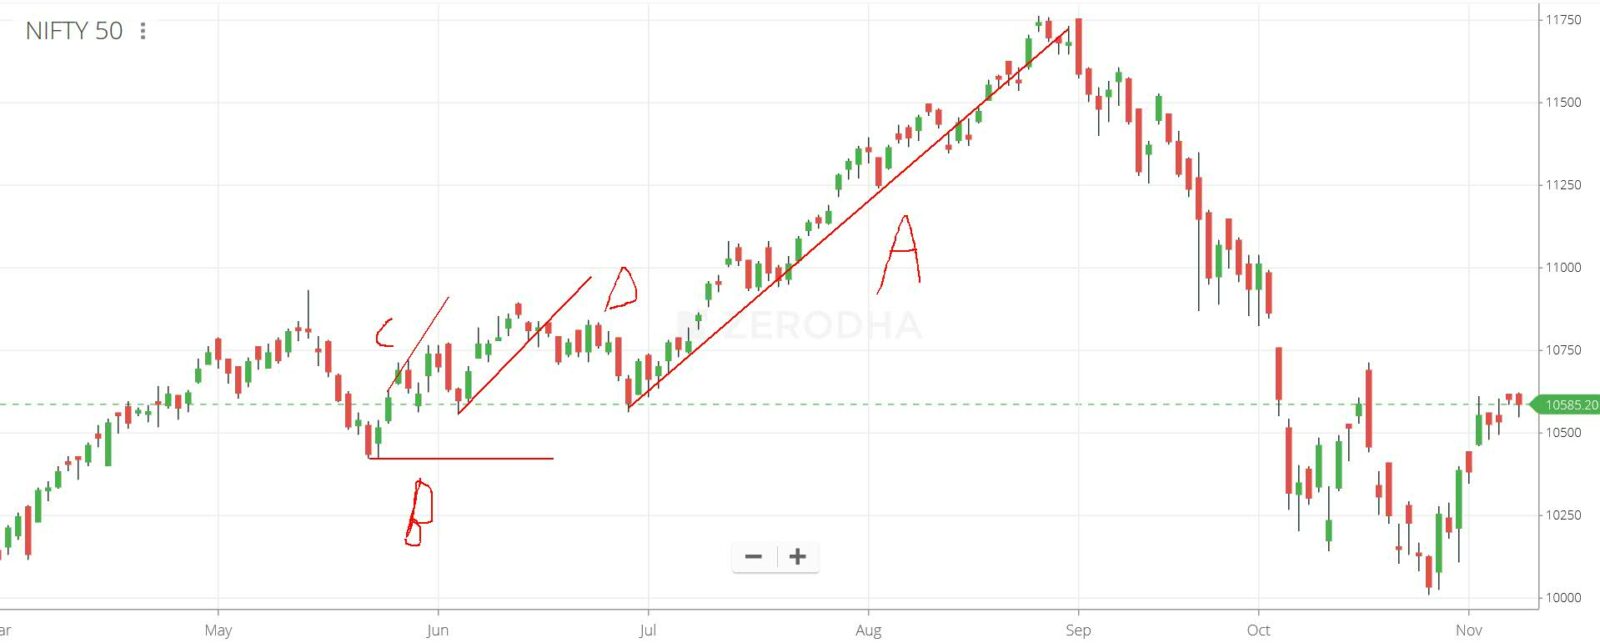
This is perhaps most important aspect of drawing trend line. It should touch more than 2 points. That is prices should touch trend line more than two times for it to be valid trend line.
Note we can draw a line using 2 points only but that would not be valid line. In below image I am showing you example of valid and invalid trend line for clarity. In below image A is valid trend while B, C and D are invalid trend lines.
2. Trend Line acts as Support and Resistance
If you closely see above image line A has been touched many times. The prices come to touch the line if they are far off from the line. Line A acts as a support level. Prices will touch and bounce from the support in a uptrend.
In a downtrend the reverse will happen. Trend Line will act as a resistance level. Prices will touch the level and fall down. You can visit my article on Support and Resistance in case of any doubts or more information on this topic.
3. Trend Line break
In recent articles we have mentioned that Trend gets reversed if support or resistance is broken. Above we said trend lines work as support and resistance. Now we will extend trend reversal and see how trend lines help us identify them.
Intraday Trend Line break is not that important. The prices should close below trend line for two successive days. If the prices close below trend line for two or more days then it is said to be reversal. If not then original trend may continue.
Note Intraday penetration for two or more days is not considered only the closing prices are considered.
4. Role Reversal Trend Lines
In support and resistance chapter we saw that Support becomes resistance and vice versa. They reverse their roles depending on the direction of price movement. The same concept is applicable for Trend Lines as well.
We have already discussed that trend lines act as support and resistance. So trend lines reverse their roles in opposite movement. Now resistance and support are price points whereas trend lines are lines drawn in direction of price movement.
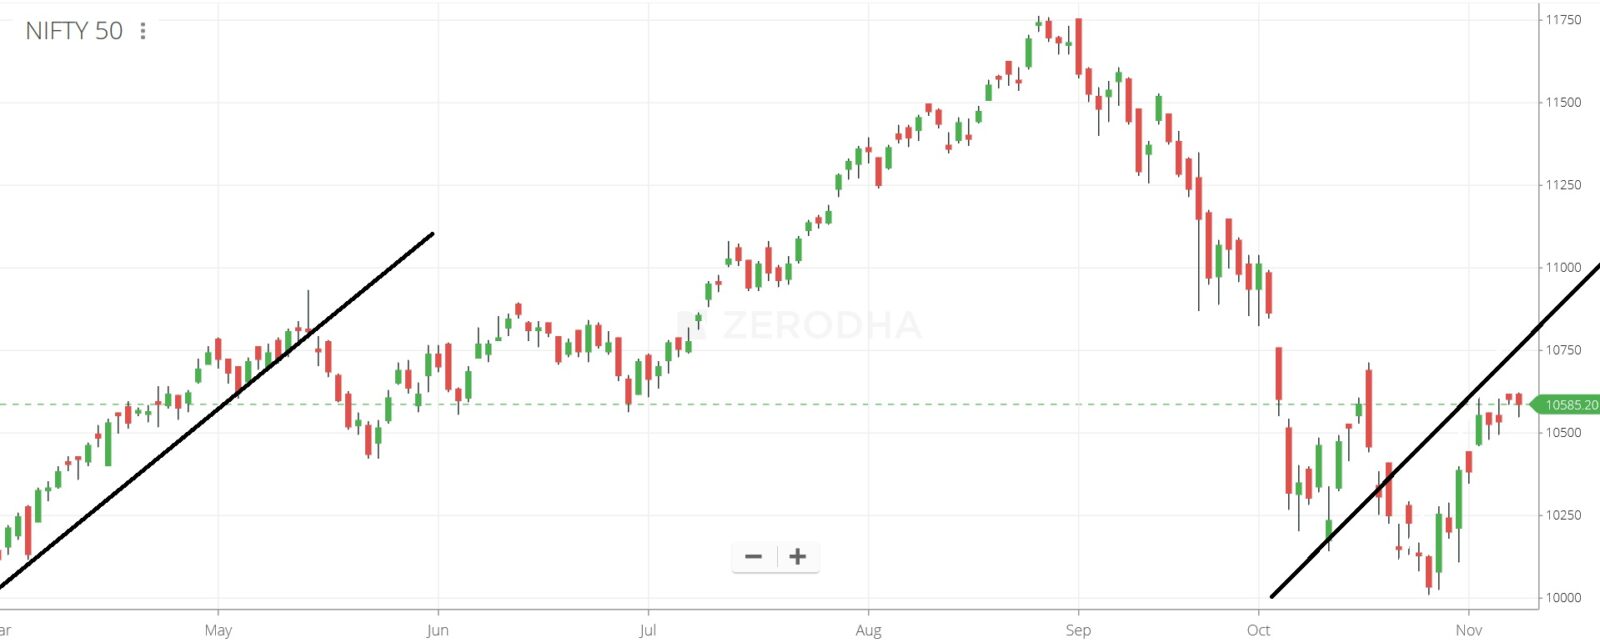
In above image a drew a line parallel to uptrend line. That line gives you resistance points. Note that around resistance point of 10,600 the prices faced difficulty to cross over and are traded for few sessions. The prices are moving downwards as well.
5. Trend Lines are Subjective
The only problem with Trend Lines are that they are subjective. New users tend to draw the lines based on their assumption. If they assume prices will go up then they will draw lines in that way.
Note due to this subjective nature of it people have come up with tool which we will see in later parts of technical analysis guide.
So if you have trouble identifying a pattern then it is better to avoid trading. You should wait for the moment till the pattern is clear enough for you to trade. If it is not clear then you can refrain from trading the security.
So remember before drawing the lines that your personal assumption or bias should not creep in. That would impact the decision making and you will lose the trade.
Conclusion
Trend Lines are tool which should not be used by Beginners to set up trade. It should be practiced and once you are good at drawing and understanding it then only you can start trading using it.